Finance toolsfor better decisions

Financial reporting, planning, and analysis to help your team track performance and make informed decisions.

These examples use synthetic business data, not results from client projects.

Monthly FP&A & Forecasting
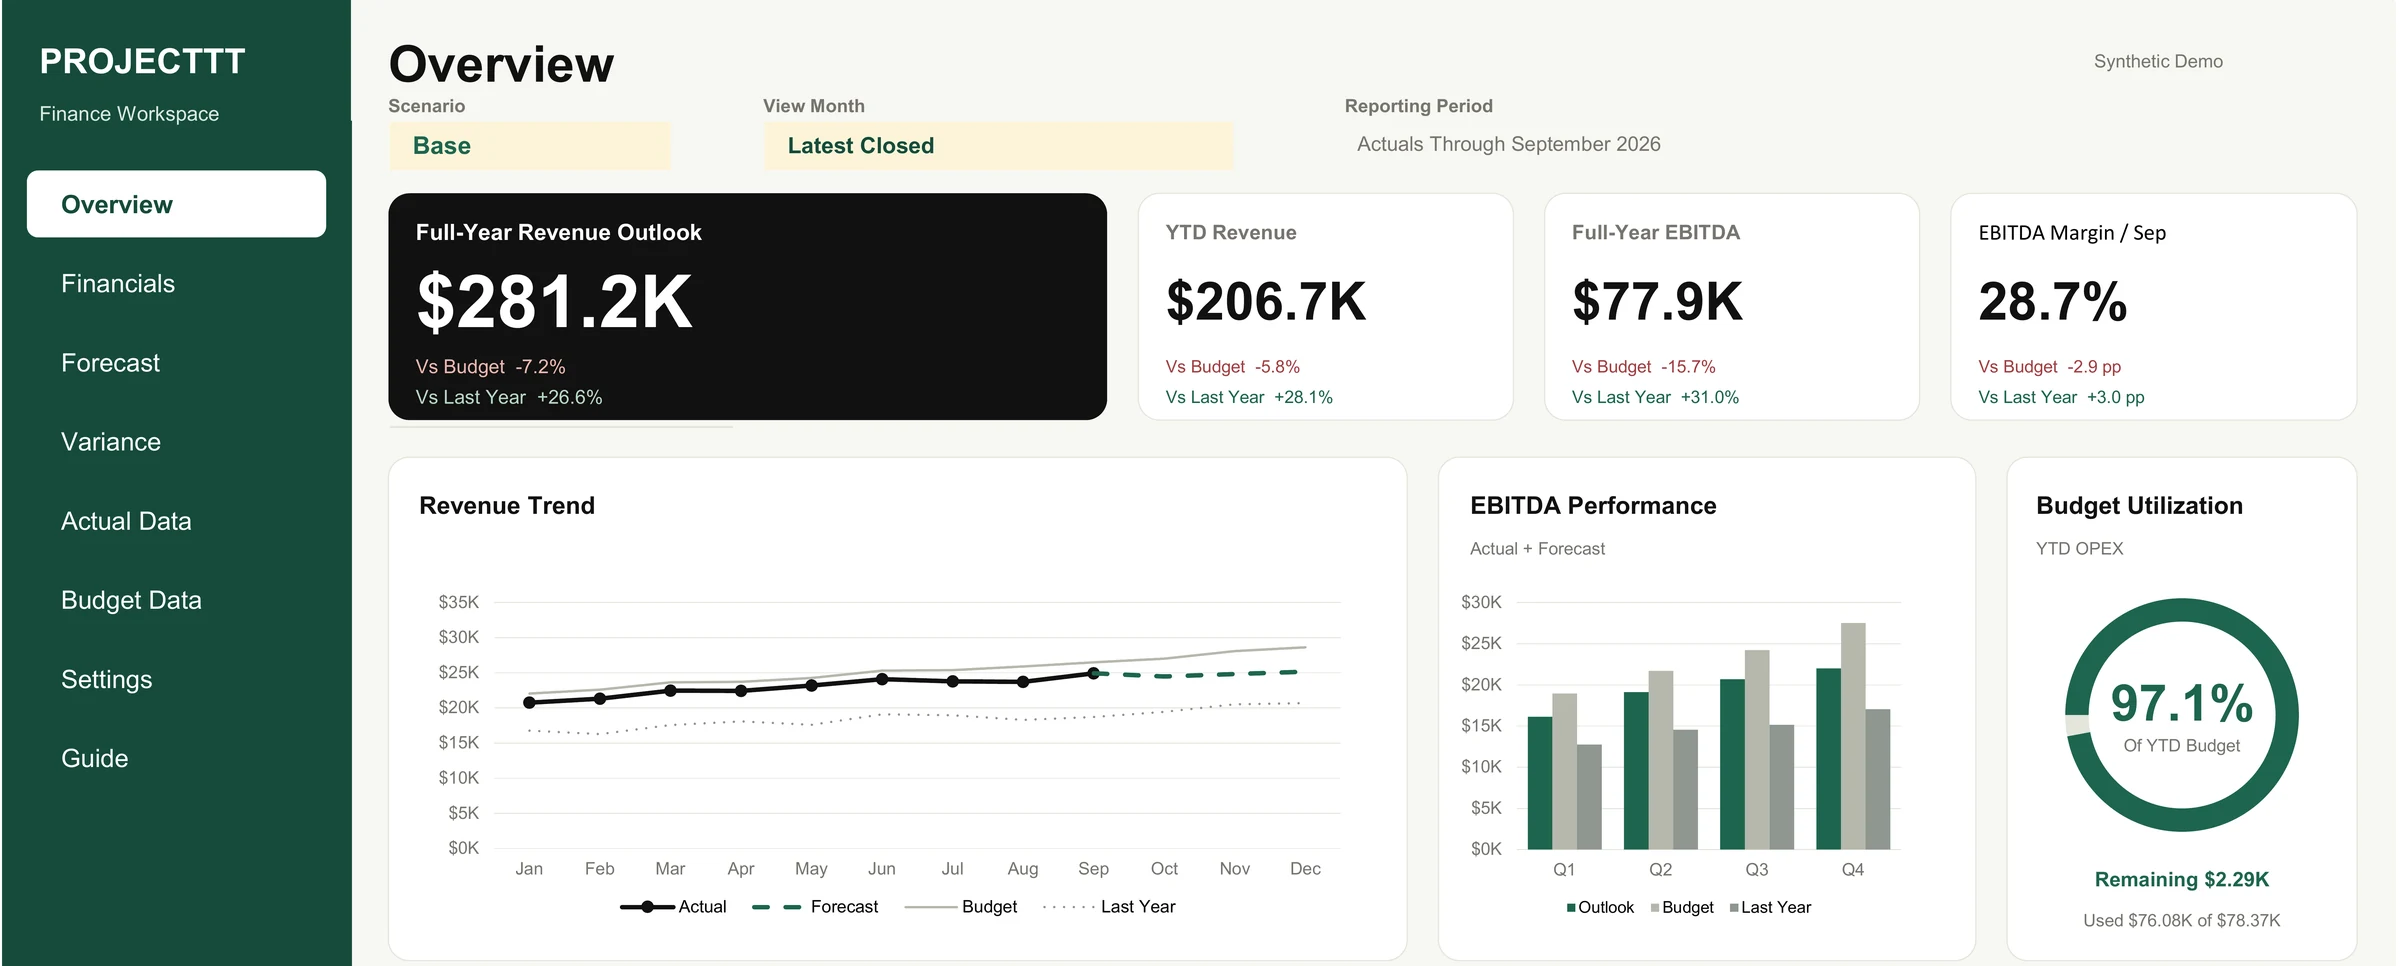
Overview sheet: headline figures, revenue trend, EBITDA and budget use.

Problem

When actual, budget, and last-year results sit in separate reports, differences are hard to spot.

System

This reporting view brings them together and helps update the forecast.

  1. Full-year revenue outlook, against budget and last year.
  2. Revenue trend: actual months, forecast, budget and last year.
  3. Share of the year’s operating budget already used.
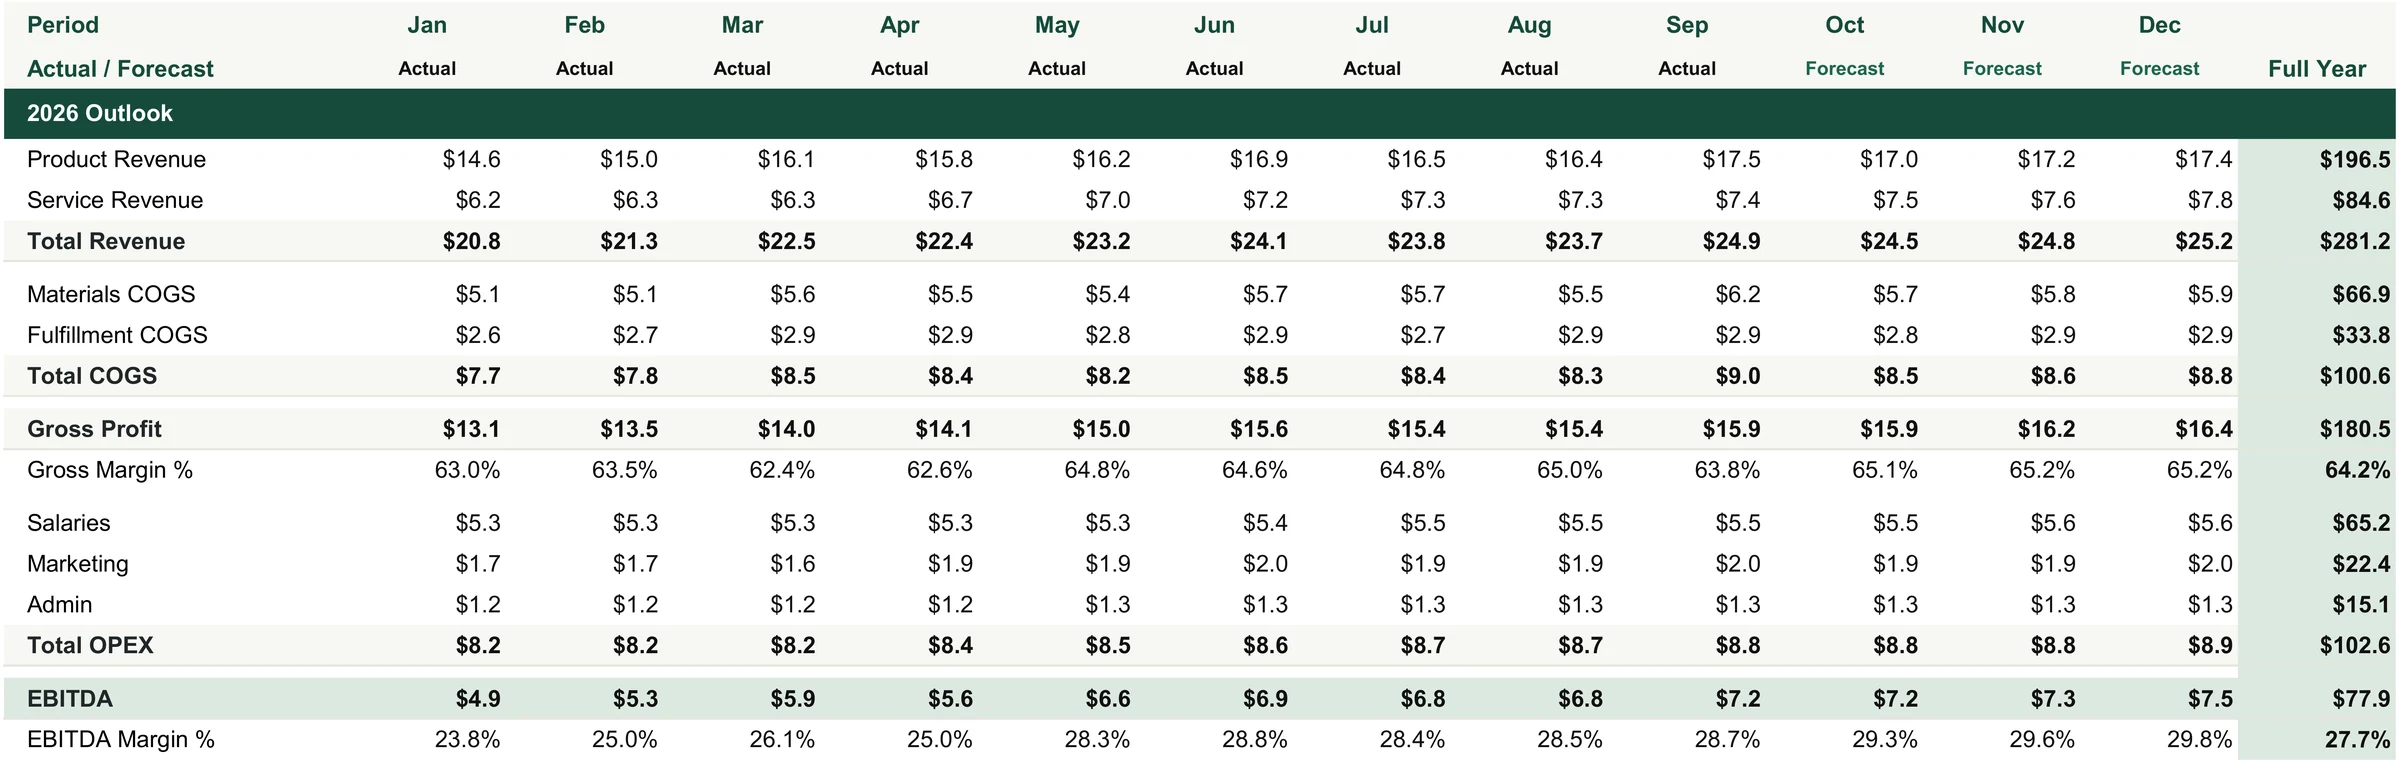
Forecast sheet: actual months to date and the forecast for the rest of the year.
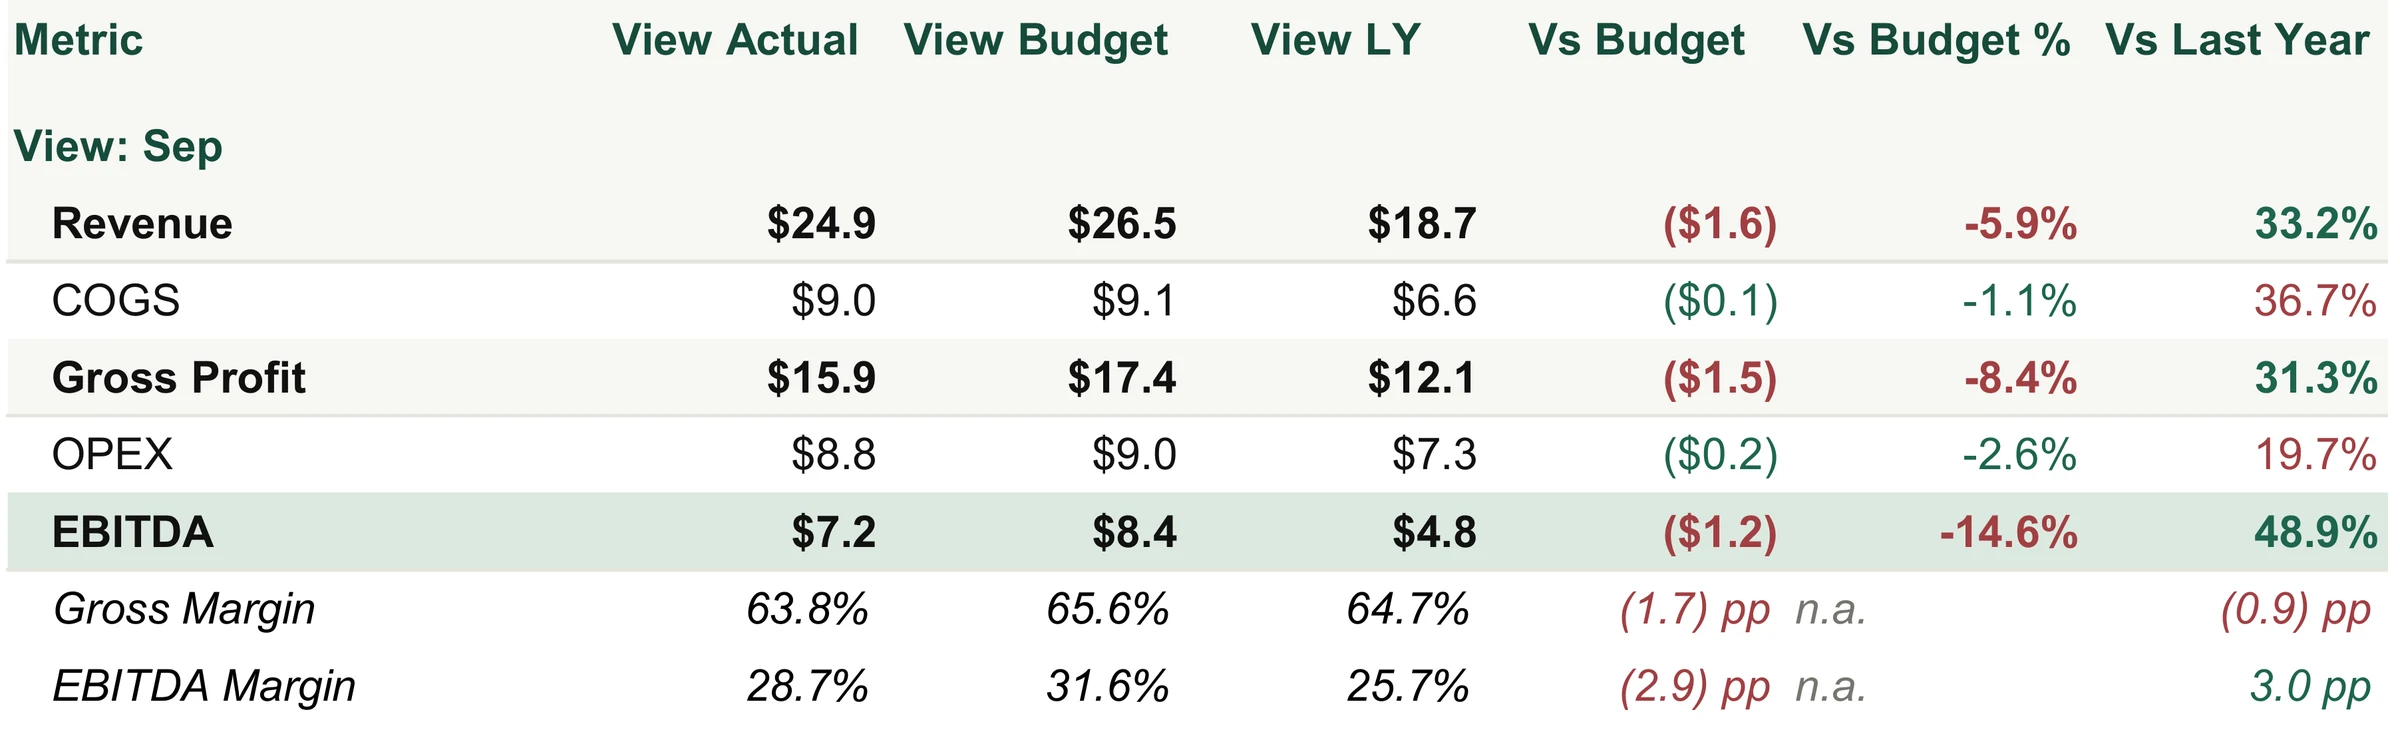
Variance sheet: actual against budget and last year, for the month and year to date.

Close-up

The full-year revenue outlook, with its gap to budget and to last year.
The last closed month, the three forecast months and the full-year totals.

Output

A workbook that updates the monthly report and the full-year forecast from actual and budget data.
Product Costing & Profitability

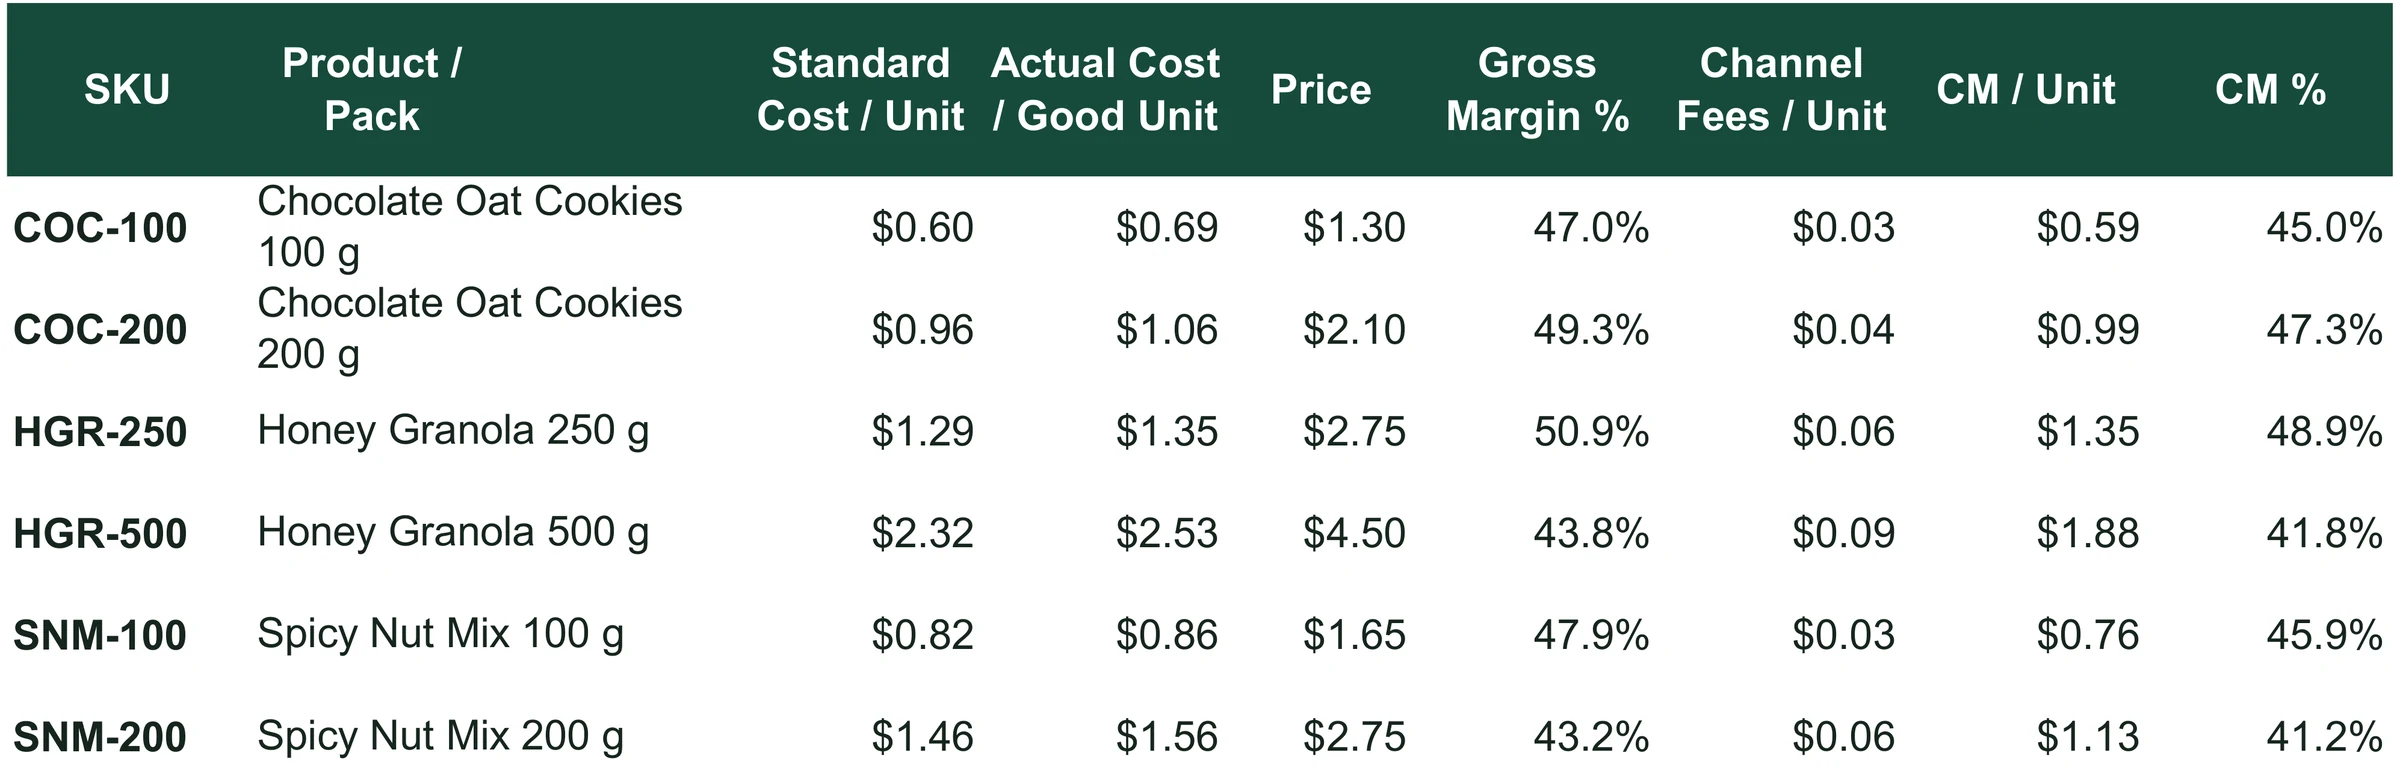
Product profitability: standard and actual cost, price, margin and channel fee per SKU.

Problem

Product margins can be misleading when channel costs are left out.

System

This costing model compares standard and actual costs to help review prices.

  1. Actual cost per good unit beside the standard.
  2. Gross margin per product after actual cost.
  3. Channel fee per unit, so margin is not overstated.
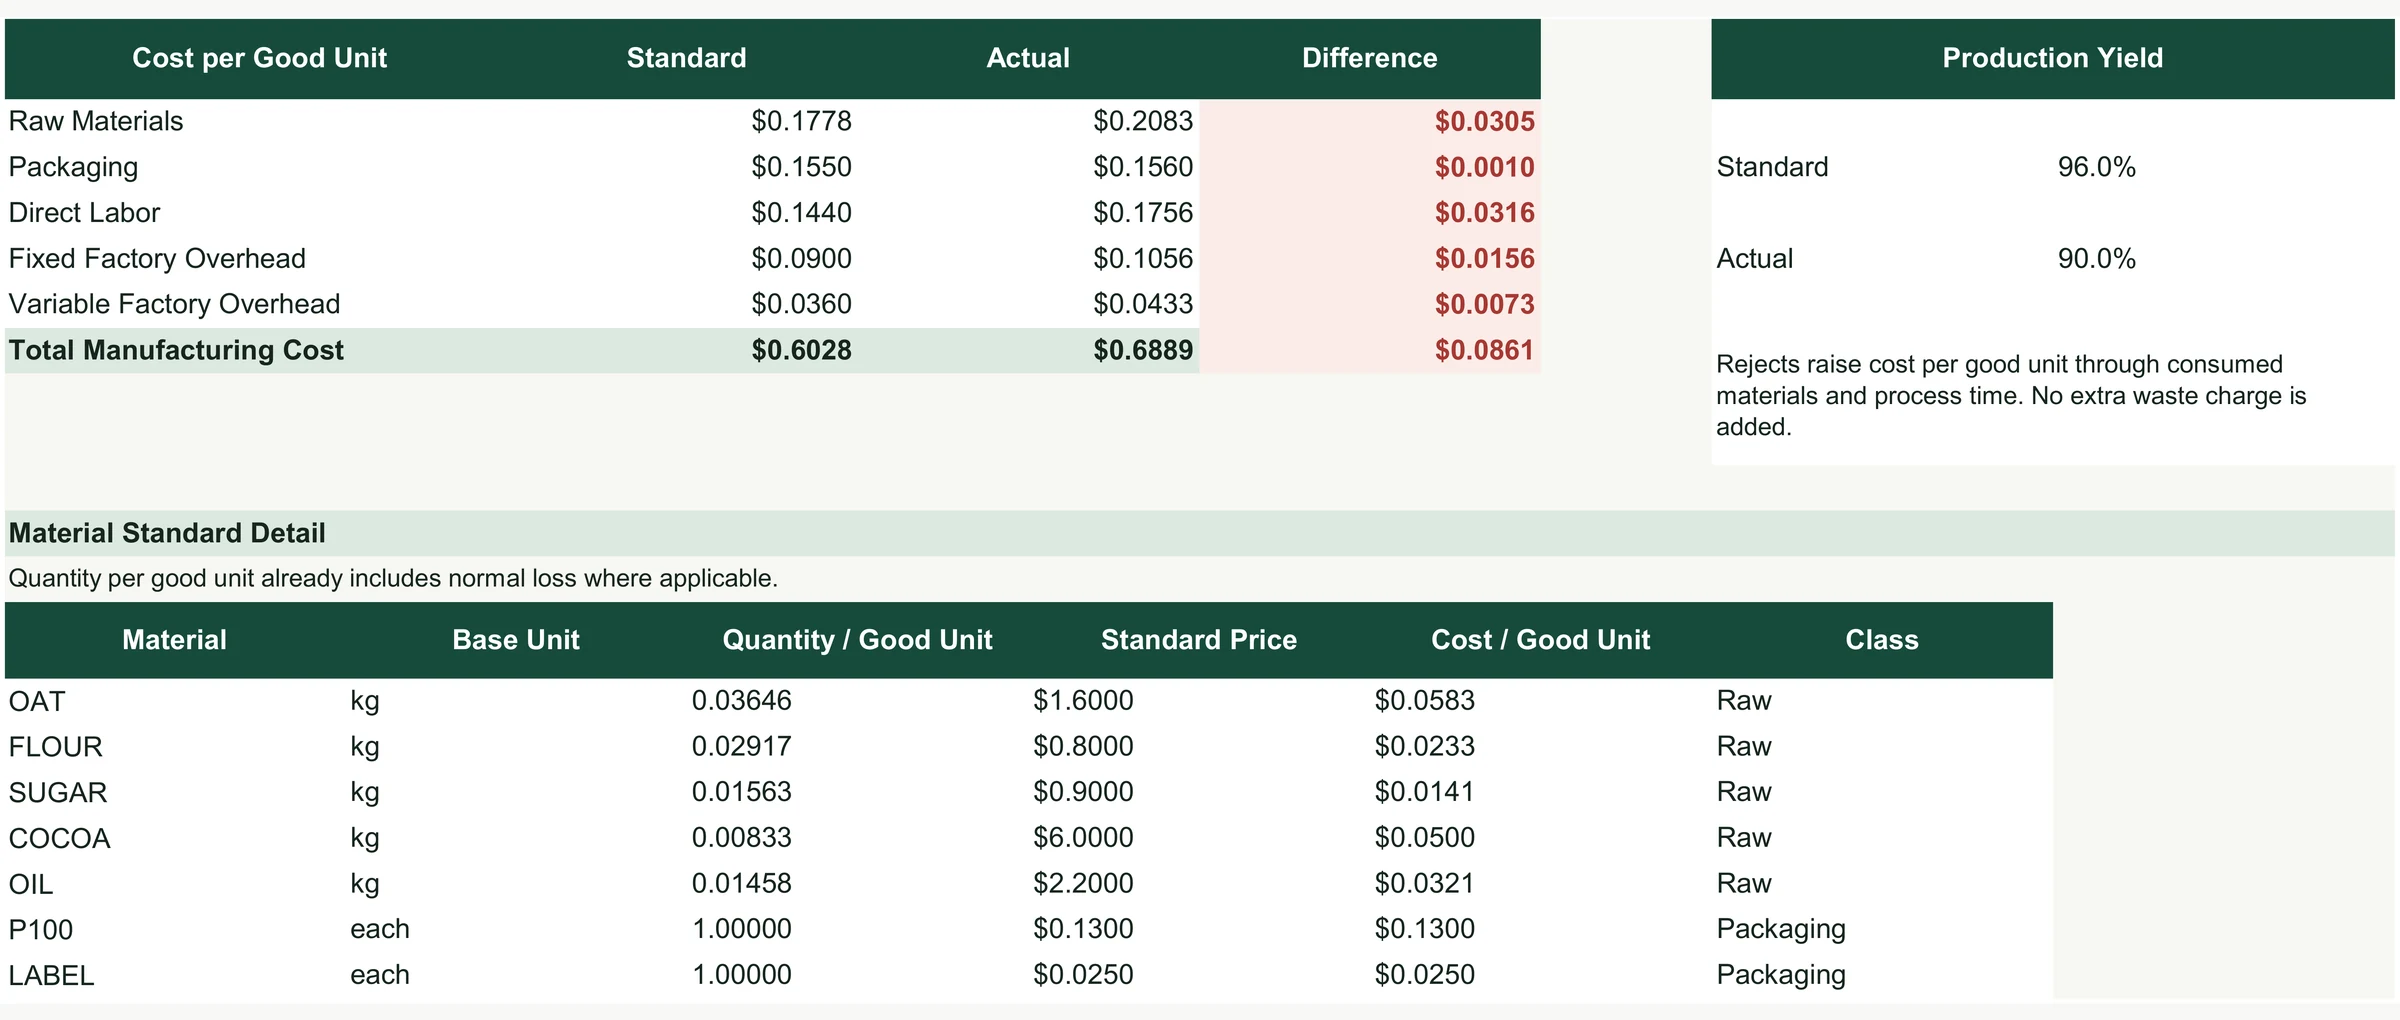
Cost per good unit, production yield and the material standard behind it.
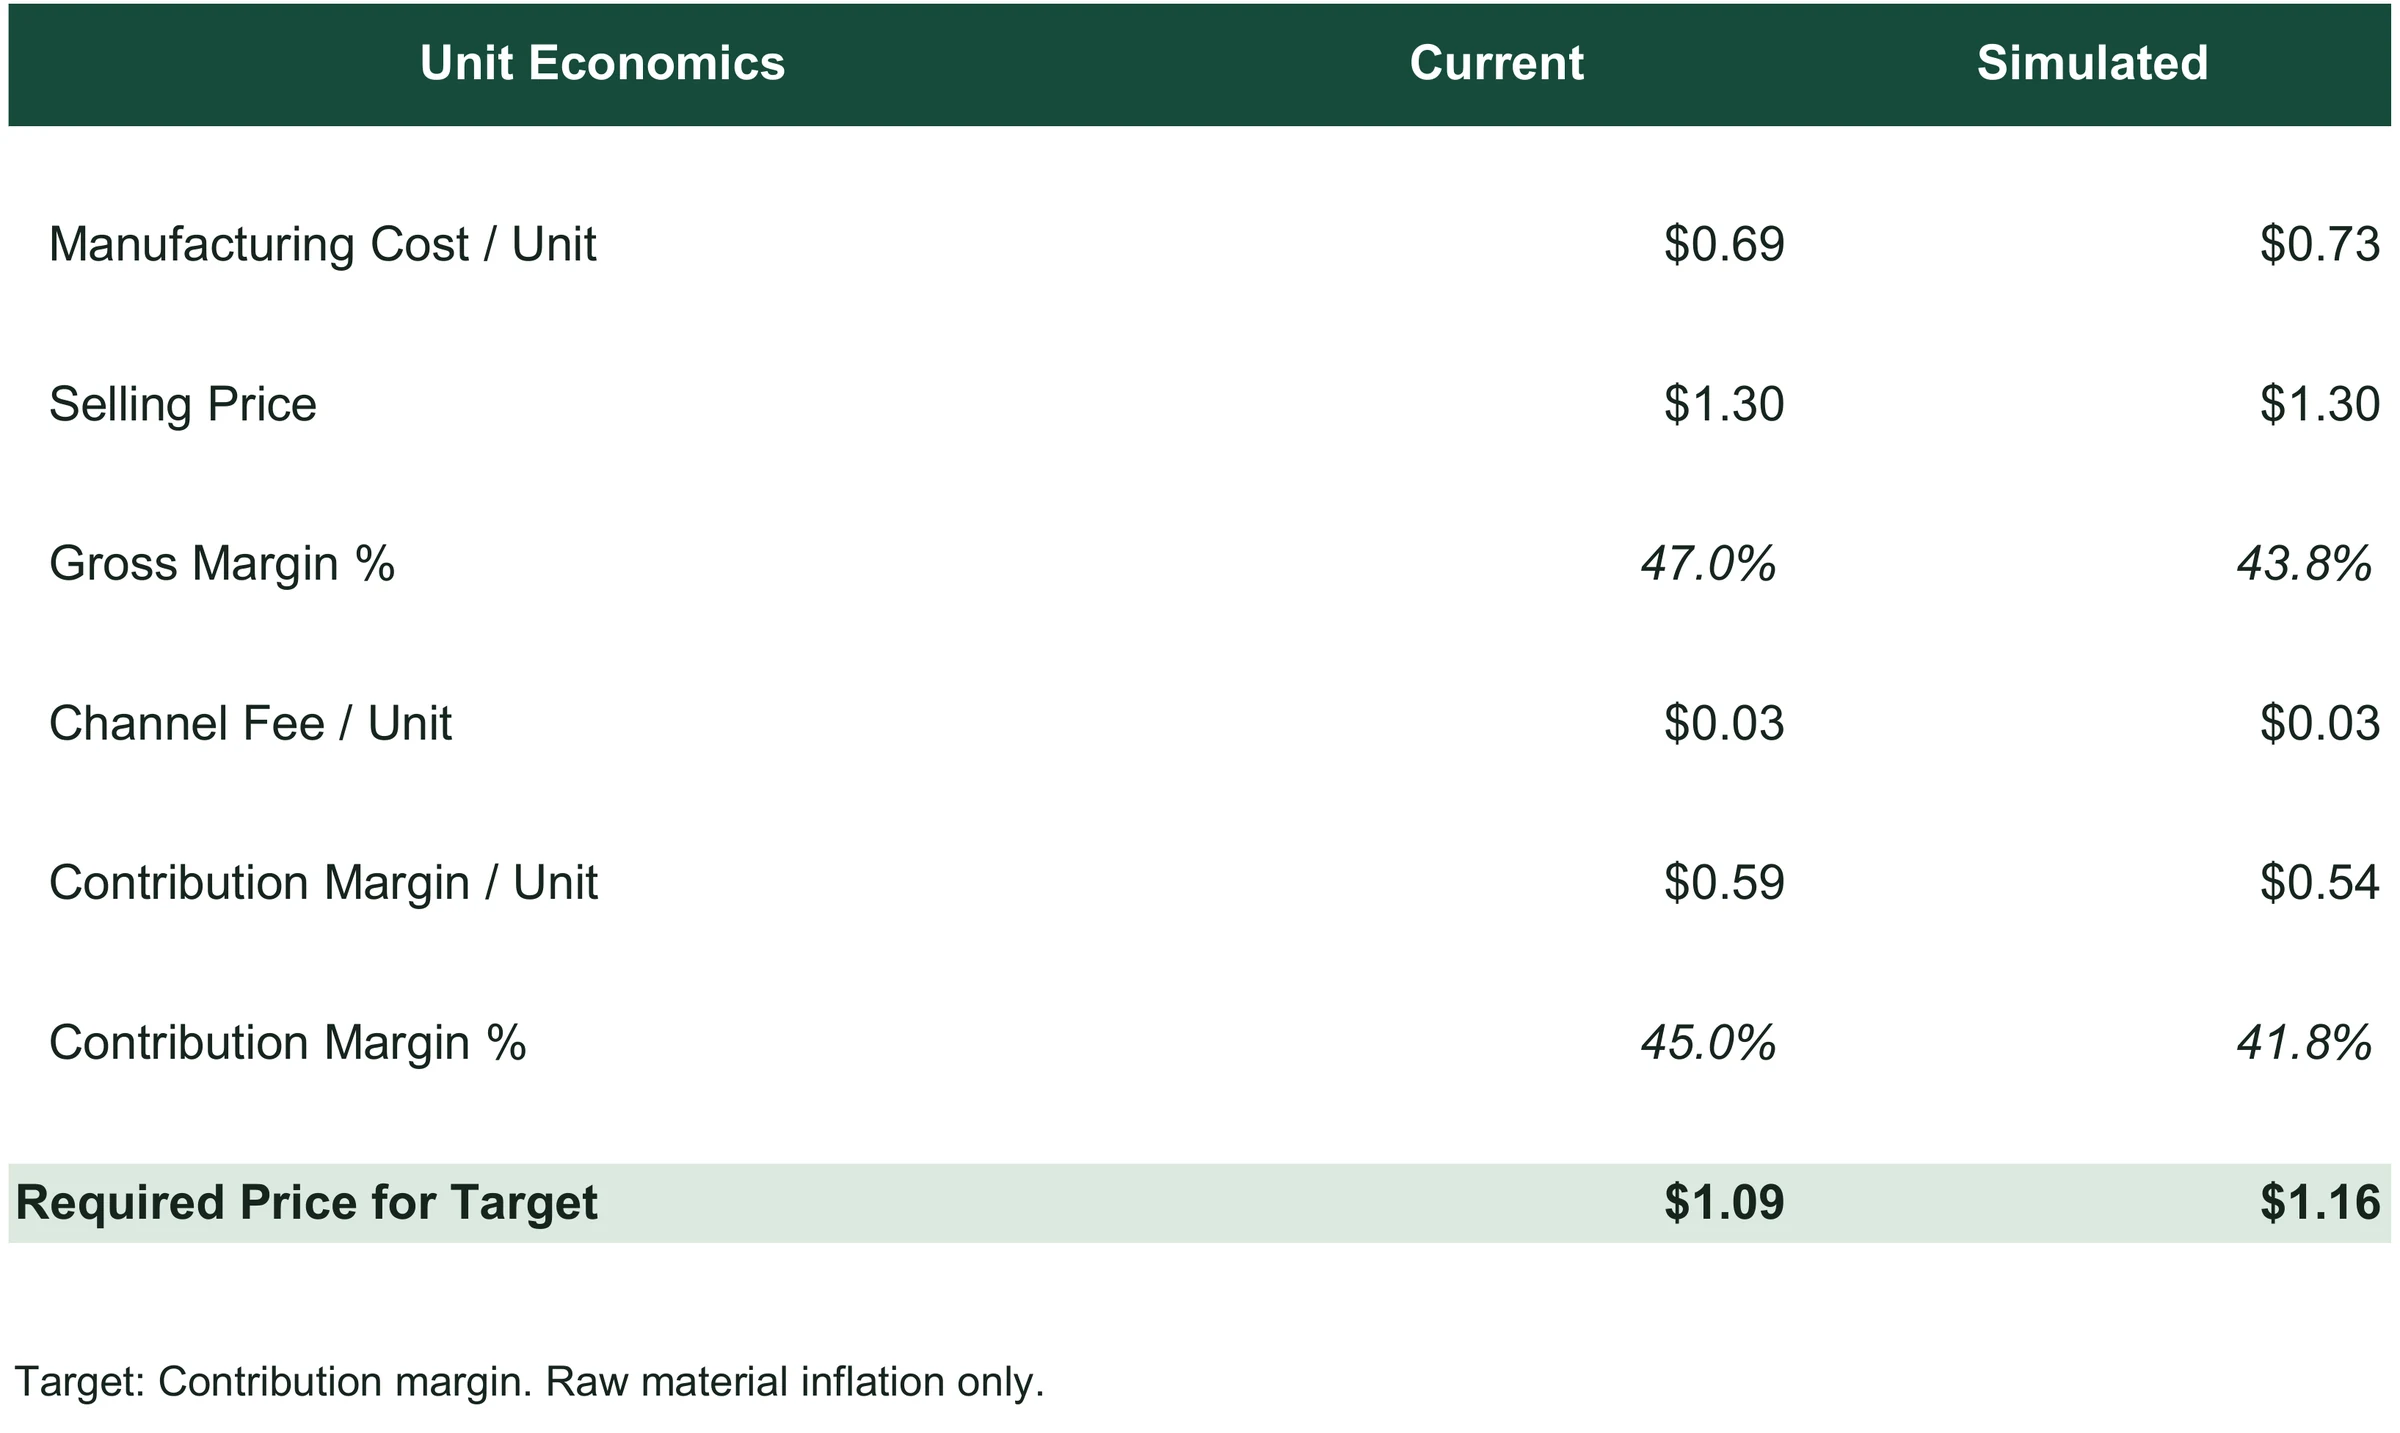
Pricing simulator: unit economics now and under a simulated cost and price.

Close-up

Standard against actual cost per good unit, and the difference.

Output

A costing model that recalculates cost and margin per product, and the price needed for a target margin.

Cash Flow & Scenario Planning

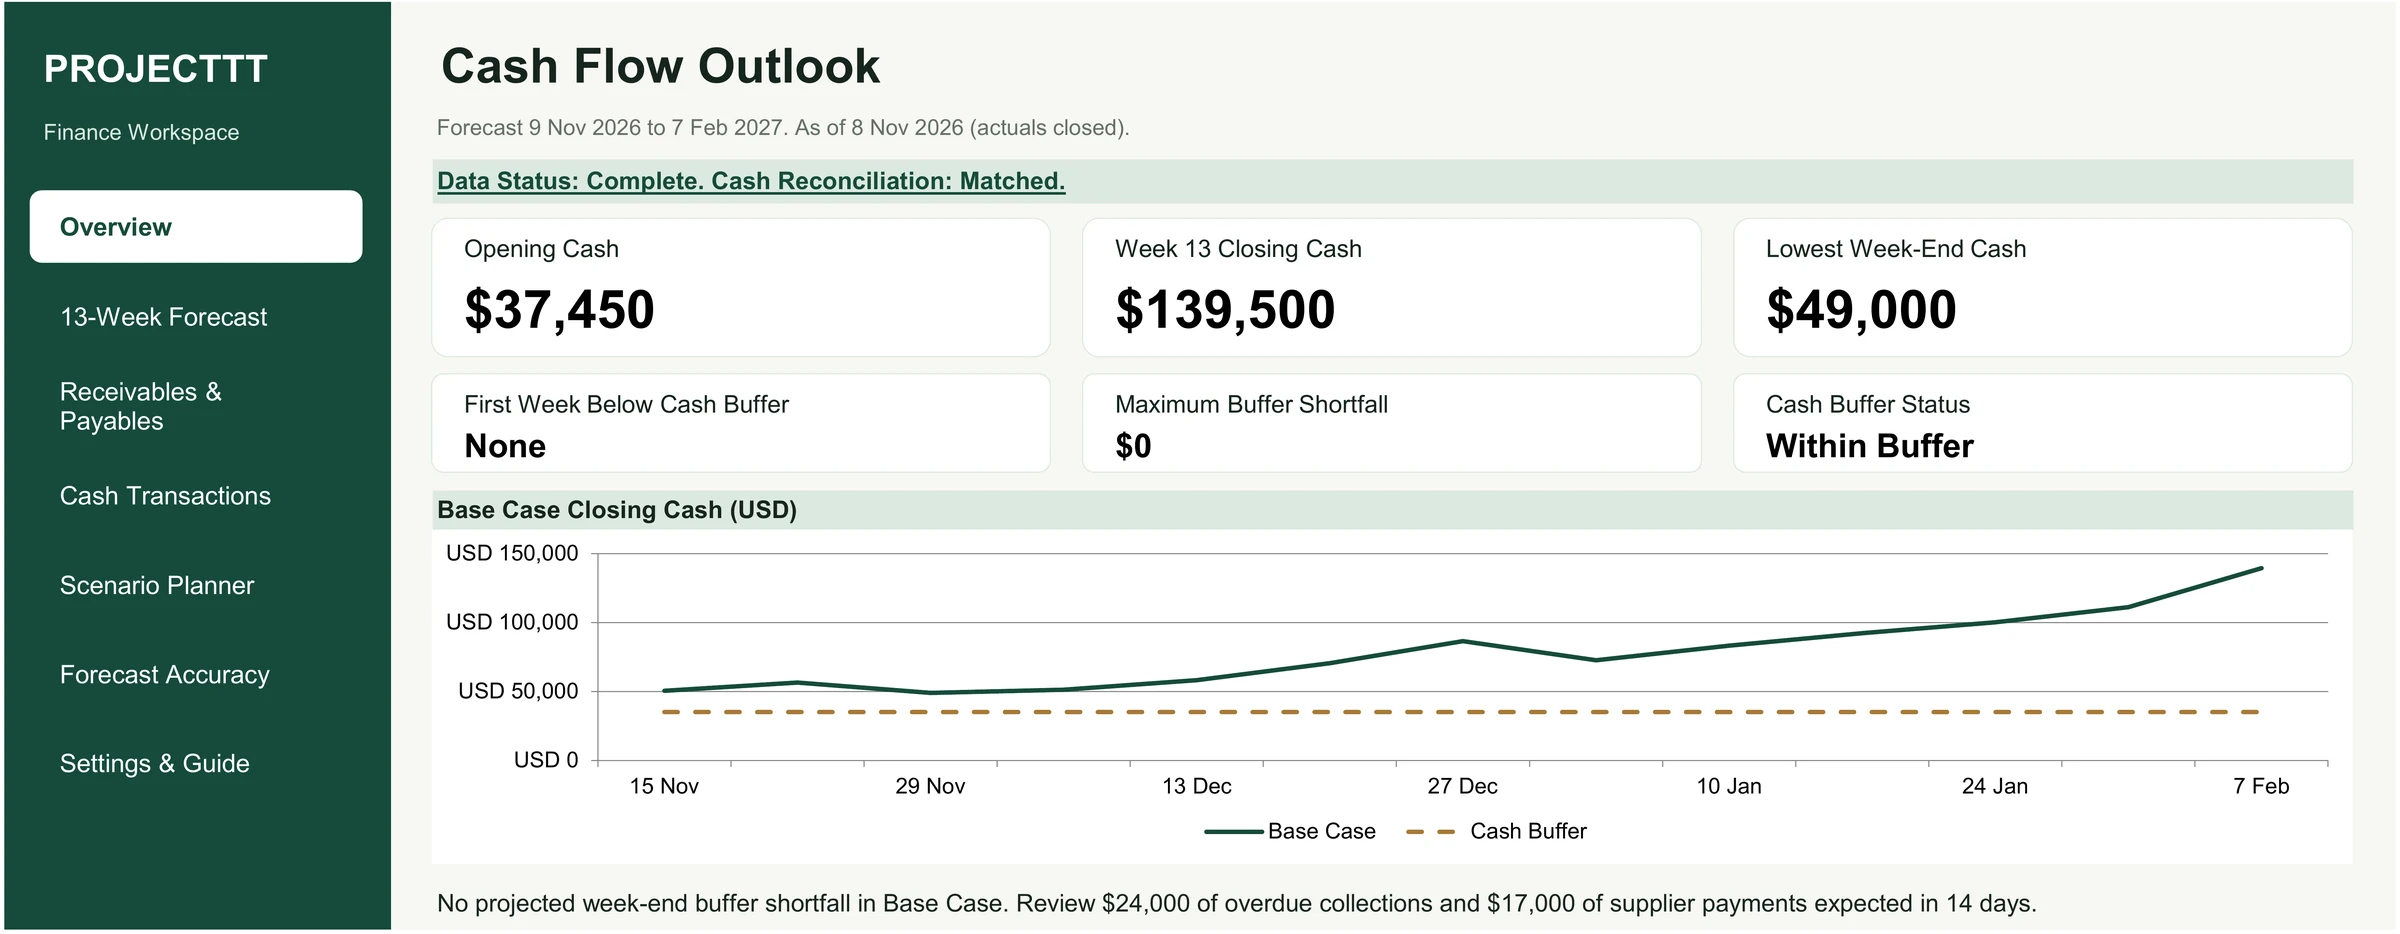
Cash flow outlook: headline figures and base-case closing cash against the buffer.

Problem

Cash shortfalls are easier to miss when receipts and payments are planned separately.

System

This 13-week view compares the base case with delayed collections and payment pressure.

  1. Opening cash, week 13 closing cash and the lowest week-end cash.
  2. Closing cash each week against the cash buffer.
  3. A one-line reading of the next two weeks.
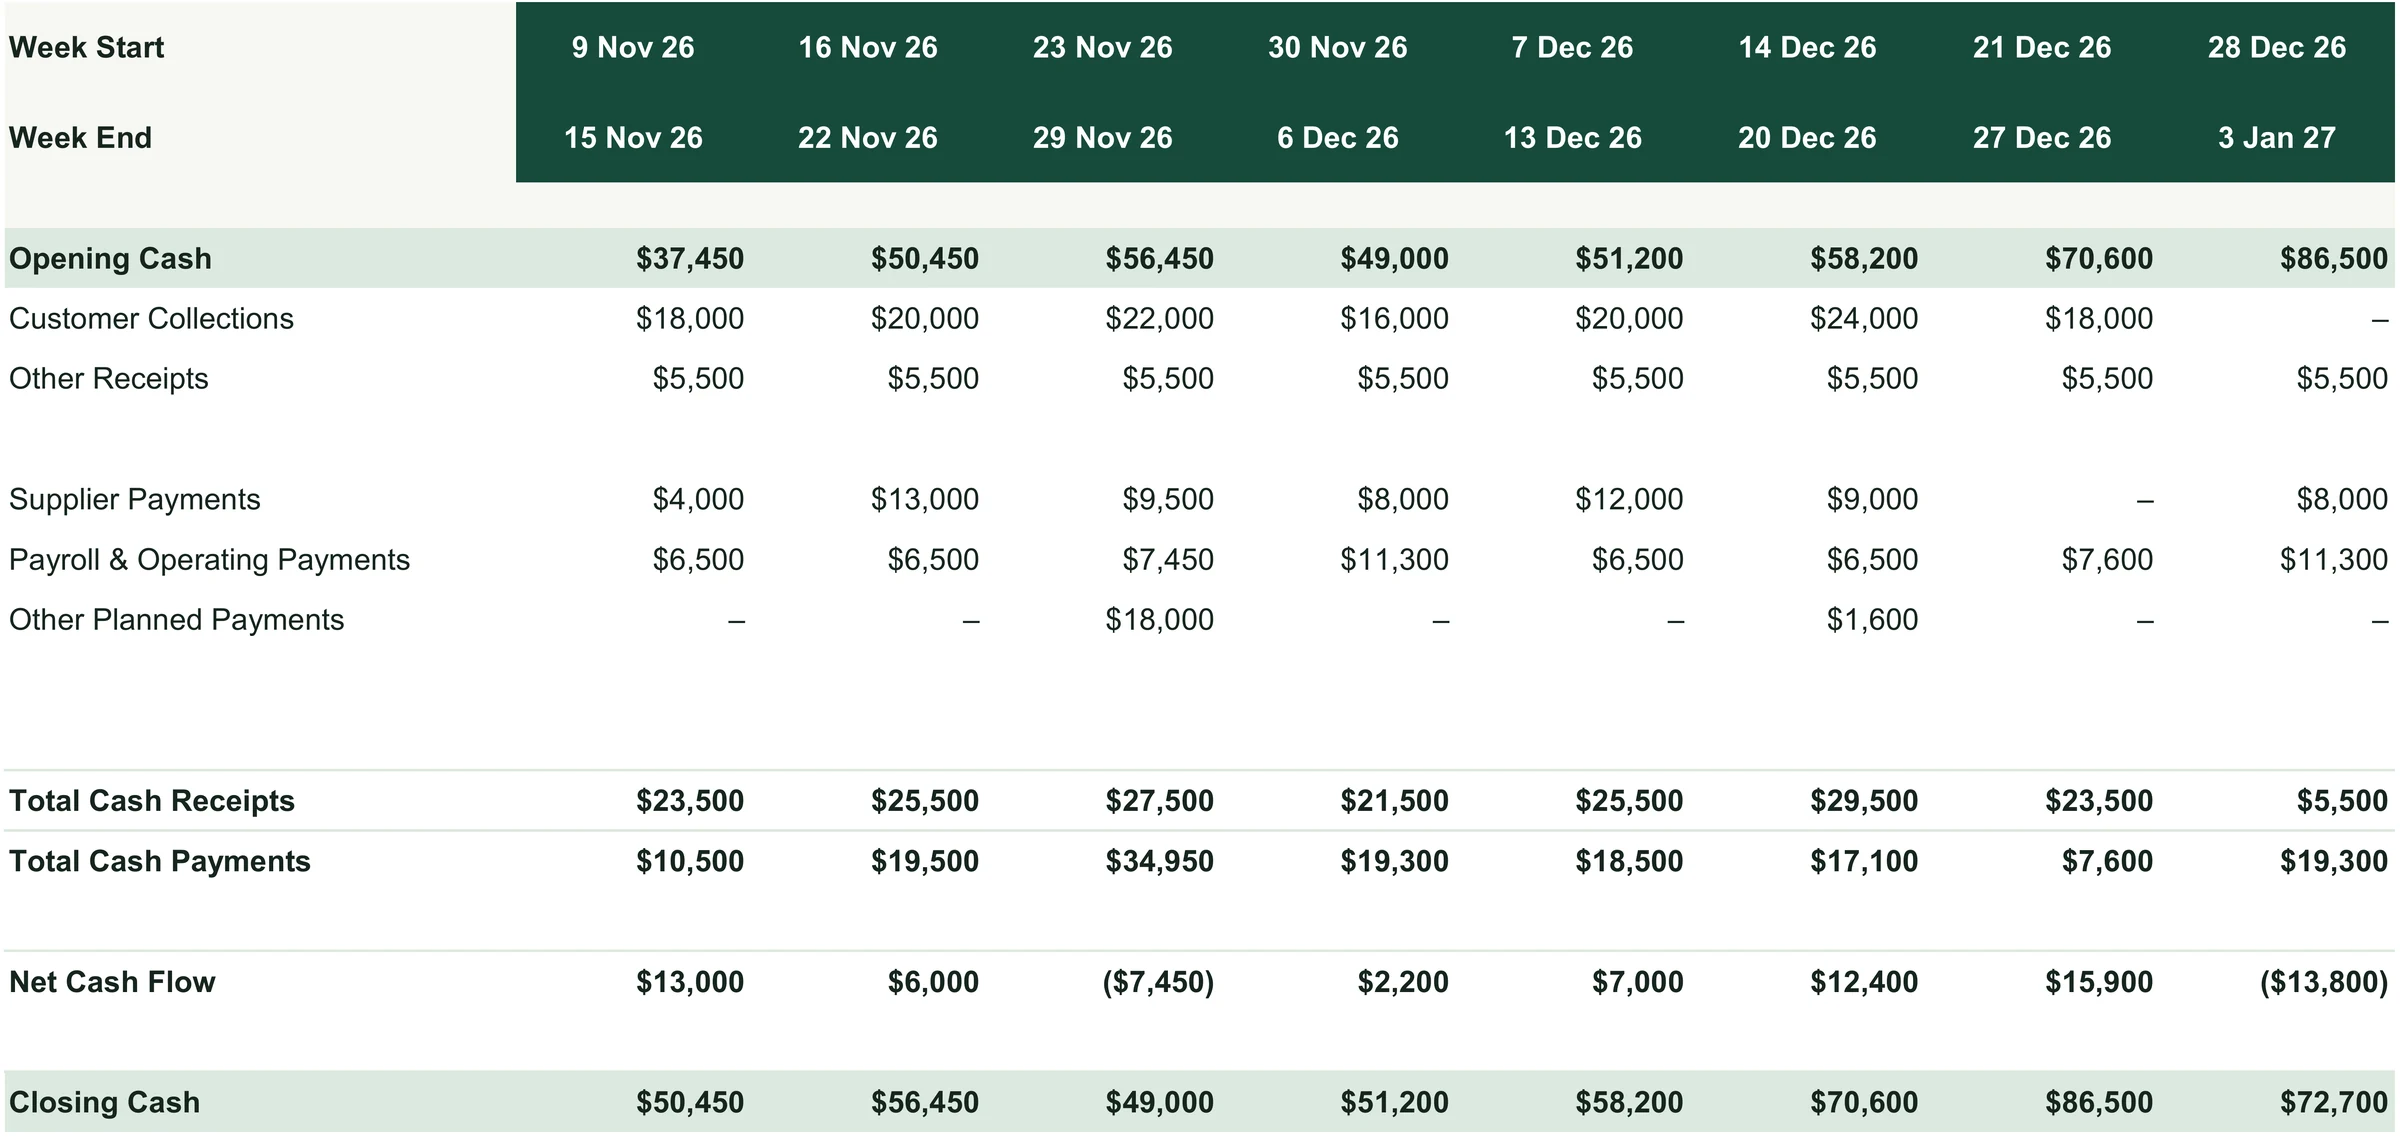
Thirteen weeks of receipts, payments, net cash flow and closing cash.
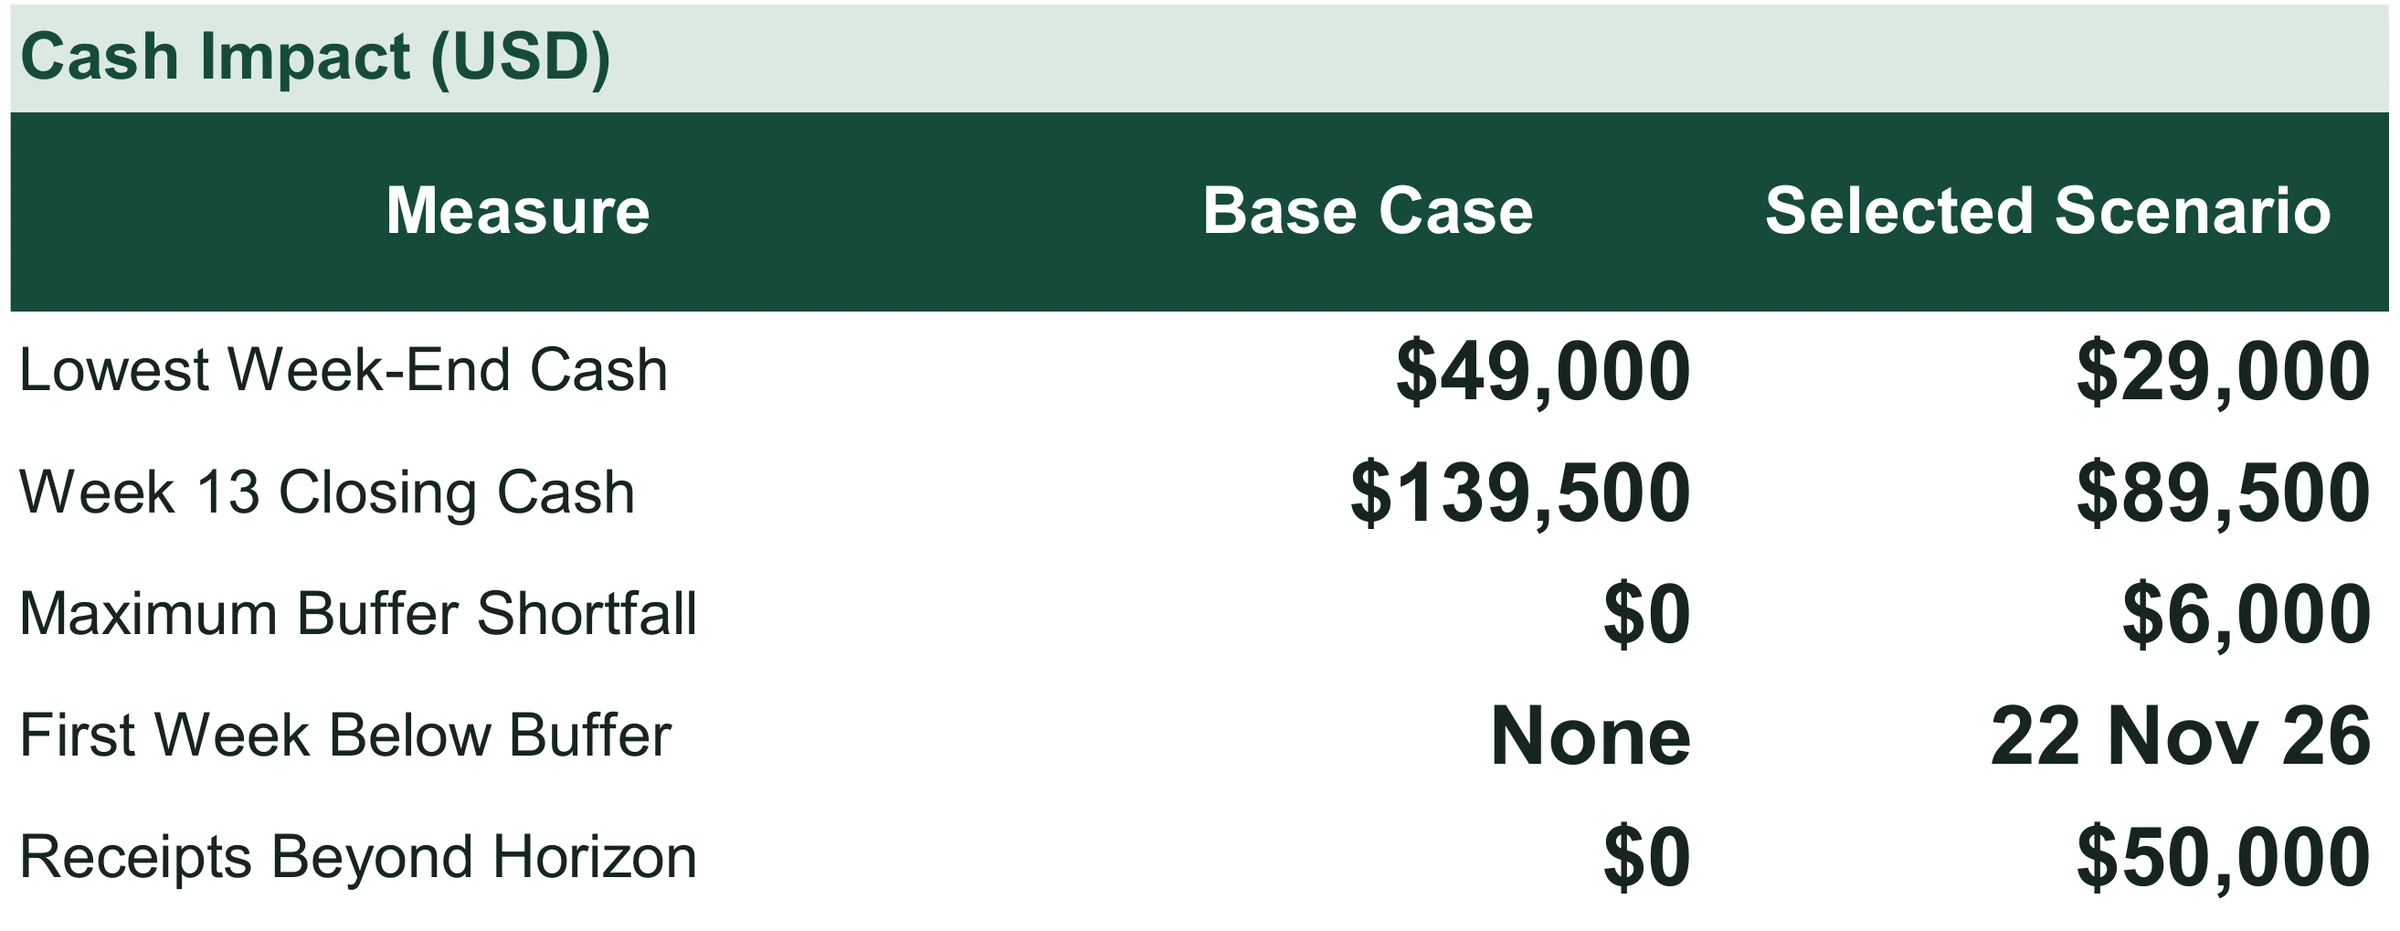
Cash impact: the base case against a selected scenario.

Close-up

The headline cash figures and the buffer status.
Receipts, payments, net cash flow and closing cash, week by week.

Output

A 13-week cash plan that compares the base case with delayed collections and payment pressure.

Need a finance report your team can maintain?