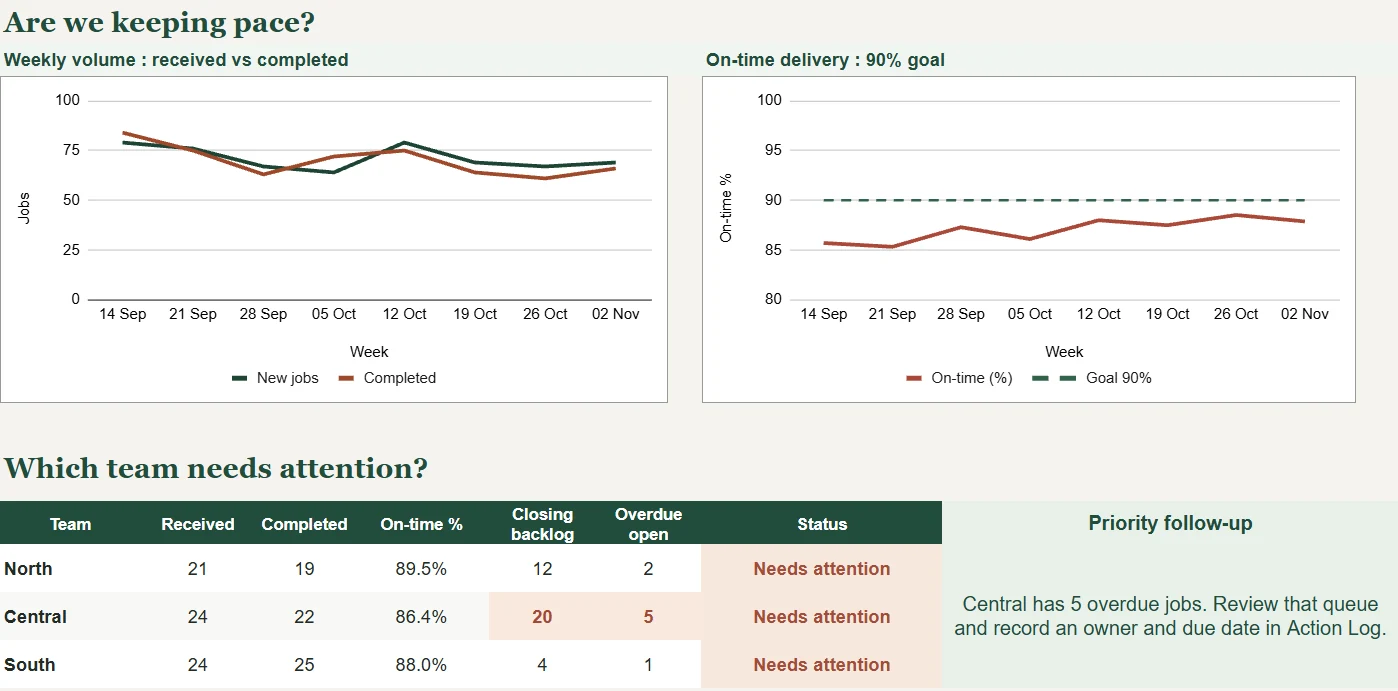
Sales & Inventory Intelligence
Problem
Sales and stock are often reviewed in separate reports.
System
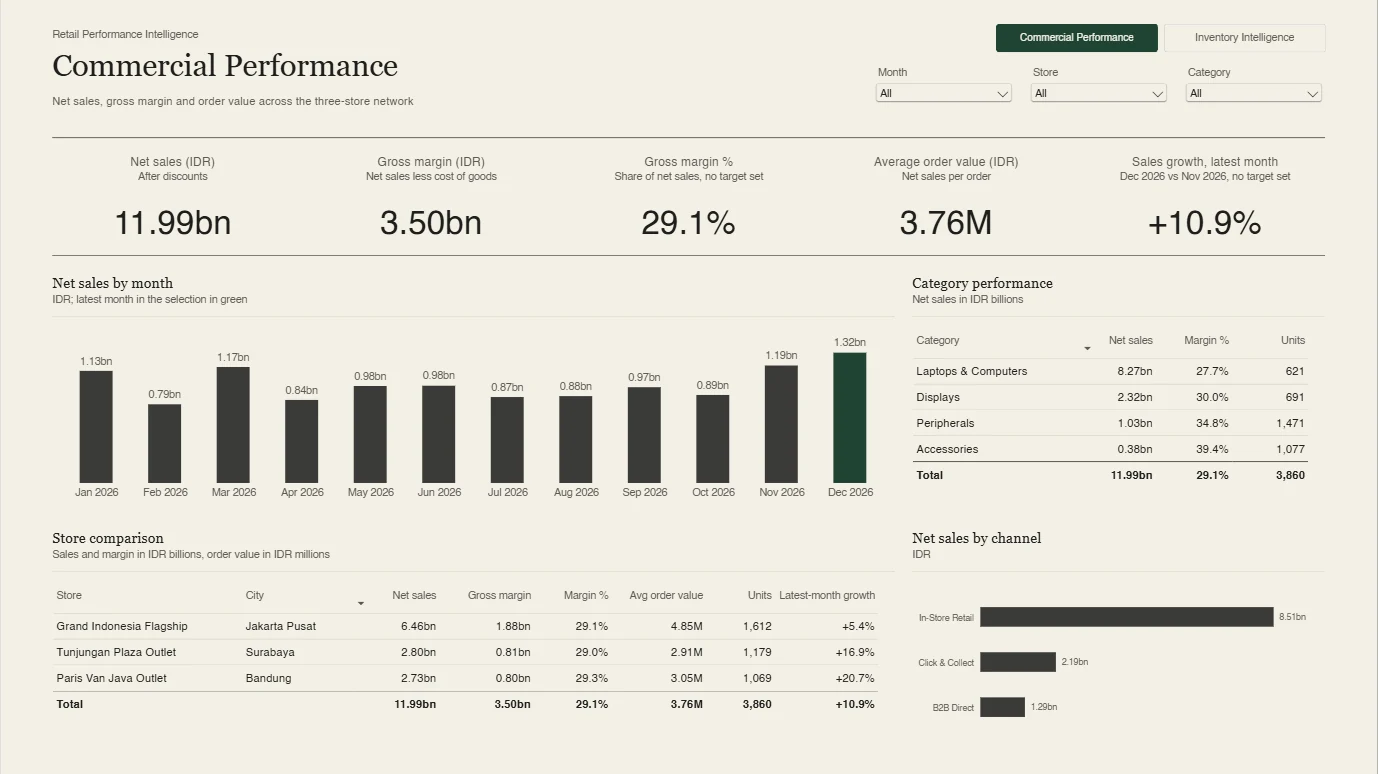
This Power BI dashboard shows sales, margins, and inventory together so teams can spot items that need attention.
- Net sales, margin and order value at a glance.
- Net sales by month, latest month highlighted.
- Category performance in one table.
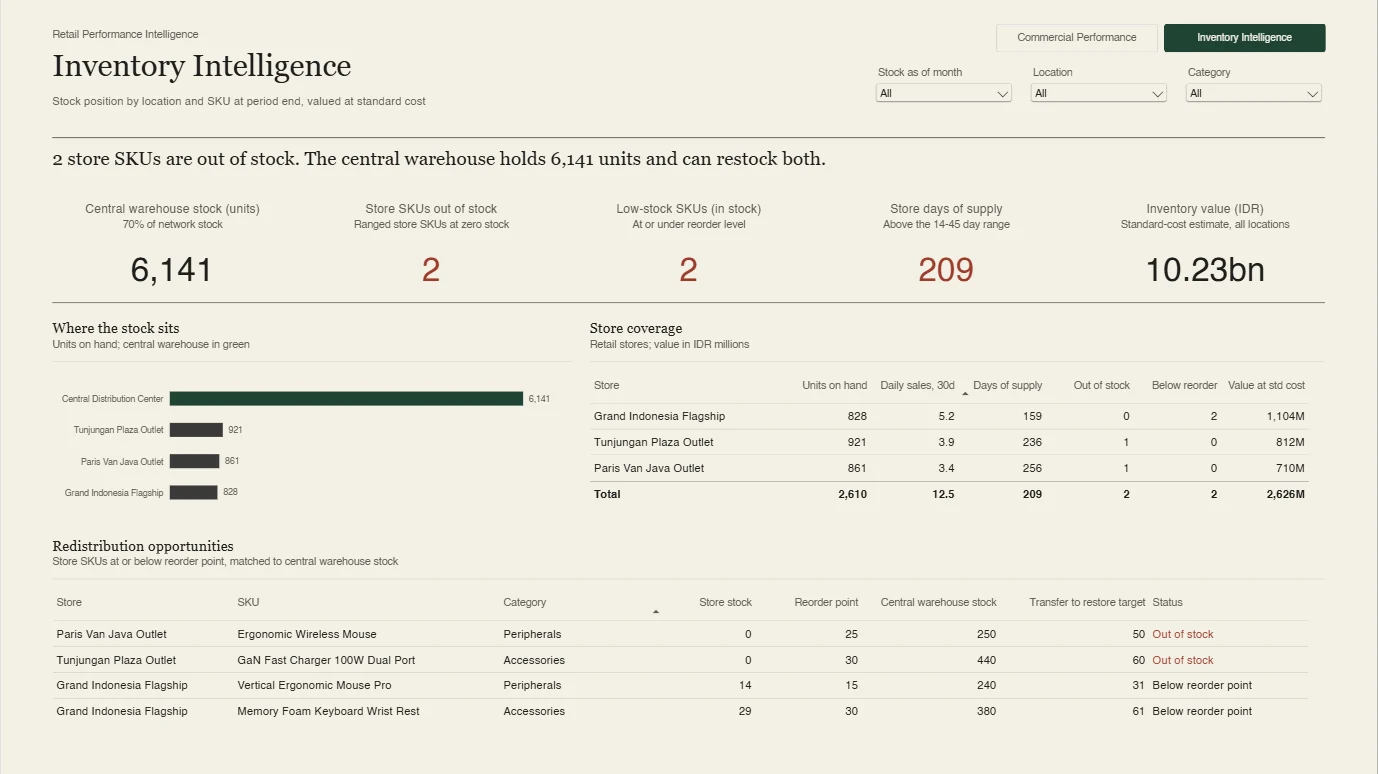
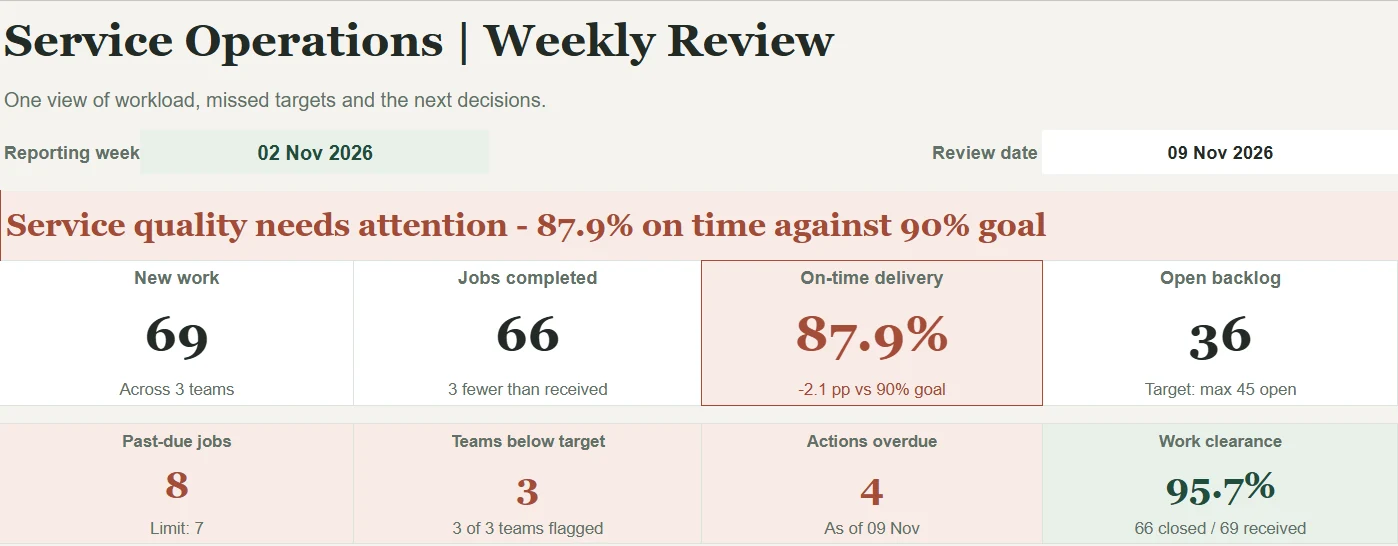
Close-up
Output
A two-page Power BI report, commercial performance and inventory, each with month, store and category filters.